Multiple Choice
Use the following table to answer the question(s) below.
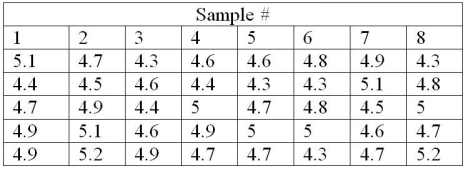
-A machine shop owner wishes to monitor the diameter of an engine boring operation where the piston bore should be 4.25". He obtains 8 samples of 5 and records the data in the table above. What should the upper and lower control limits be for an R chart?
A) (5.00, 8.00)
B) (0.00, 2.50)
C) (4.33, 5.12)
D) (0.00, 1.45)
E) (-5.10, 5.10)
Correct Answer:

Verified
Correct Answer:
Verified
Q8: Design a control chart to monitor the
Q24: The _ reflects a population distribution.<br>A) p
Q37: A g chart is useful when data
Q43: Process charts are graphs designed to signal
Q63: Which of the following is true of
Q67: Although <span class="ql-formula" data-value="
Q70: Statistical process control charts are tools for
Q71: If a systematic sample is performed according
Q76: The upper and lower specifications for metal
Q85: Consumer's risk is also called a _