Multiple Choice
Use the following table to answer the question(s) below.
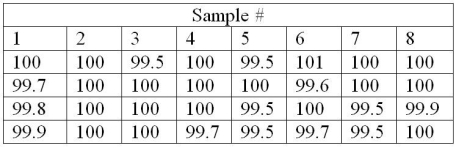
-Close tolerances are required in the manufacturing section of an automotive parts business. Since the customers demand quality, the owner wants to monitor the operation closely using statistical process control. After taking 8 samples of size 4, the owner finds himself with the data in the table above. What is the center line for a chart that will monitor process dispersion?
A) 0.45
B) 0.30
C) 0.00
D) 0.75
E) cannot be determined from the information given
Correct Answer:

Verified
Correct Answer:
Verified
Q20: Which of the following is an example
Q38: The diameter of a mason jar is
Q49: The R chart is a process chart
Q54: Variation within the data in a _
Q64: _ is useful because it ensures independence
Q66: The lower limit of R is zero
Q68: _ happens when statistical quality analysis fails
Q92: What is the first step in developing
Q95: Use the following table to answer the
Q98: The _ chart is used in