Multiple Choice
Figure 4-5
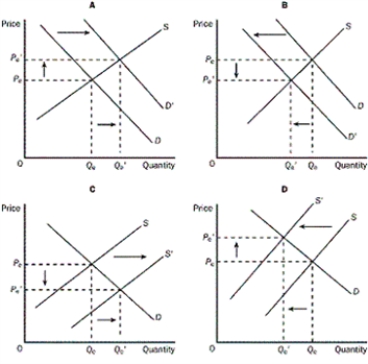
-Refer to the Figure 4-5.Which of the four graphs represents the market for school supplies in September
A) graph A
B) graph B
C) graph C
D) graph D
Correct Answer:

Verified
Correct Answer:
Verified
Related Questions
Q2: What happens in a competitive market?<br>A) There
Q79: What does fewer sellers in the market
Q82: In a competitive market, why does each
Q127: A market is a group of buyers
Q128: Fill in the accompanying table,showing whether equilibrium
Q131: Which of the following is NOT a
Q142: If a surplus exists in a market,
Q209: What does the number of buyers affect?<br>A)
Q248: Which of the following is NOT a
Q265: If cigarettes and marijuana had been found