Multiple Choice
Figure 4-8 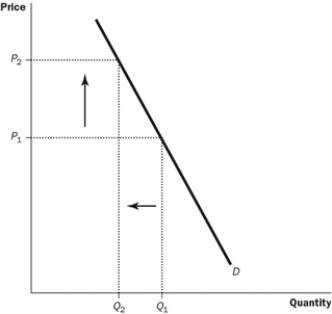
-Refer to the Figure 4-8. The graph shows the demand for cigarettes. Which most likely happened?
A) The price of marijuana rose.
B) Mandatory health warnings were placed on cigarette packages.
C) Several foreign countries banned Canadian cigarettes in their countries.
D) A tax was placed on cigarettes.
Correct Answer:

Verified
Correct Answer:
Verified
Q238: Market demand is given as Qd =400
Q239: Whenever a determinant of demand other than
Q240: What does a demand curve illustrate?<br>A) the
Q241: You lose your job and, as a
Q242: Figure 4-4 <img src="https://d2lvgg3v3hfg70.cloudfront.net/TB7554/.jpg" alt="Figure 4-4
Q244: Suppose that the incomes of buyers in
Q245: Figure 4-3 <img src="https://d2lvgg3v3hfg70.cloudfront.net/TB7554/.jpg" alt="Figure 4-3
Q246: Sugar is a normal good. You observe
Q247: What does the law of demand imply?<br>A)
Q248: Which of the following is NOT a