Multiple Choice
Figure 4-9 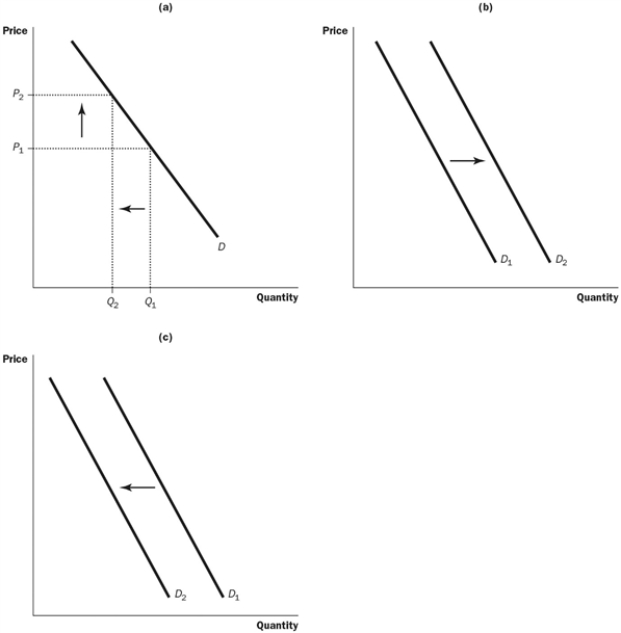
-Refer to the Figure 4-9. Which graph could be used to show the result of 5 percent of the country's smokers deciding to stop smoking?
A) graph a
B) graph b
C) graph c
D) both a and c could be used to show the result
Correct Answer:

Verified
Correct Answer:
Verified
Q161: <img src="https://d2lvgg3v3hfg70.cloudfront.net/TB7554/.jpg" alt=" -Refer to the
Q162: Figure 4-6 <img src="https://d2lvgg3v3hfg70.cloudfront.net/TB7554/.jpg" alt="Figure 4-6
Q163: What would happen to the equilibrium price
Q164: What is a table called that shows
Q165: In a free market, who determines how
Q167: If buyers and/or sellers are price takers,
Q168: When it comes to people's tastes, what
Q169: <img src="https://d2lvgg3v3hfg70.cloudfront.net/TB7554/.jpg" alt=" -Refer to the
Q170: Which of the following would be most
Q171: Sugar is a normal good. You observe