Multiple Choice
Figure 4-10 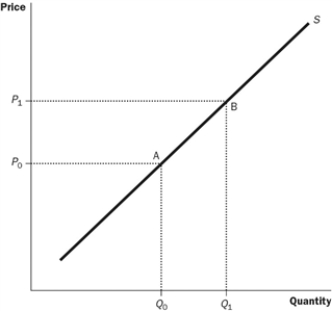
-Refer to the Figure 4-10. What is the movement from point A to point B on the graph called?
A) a decrease in supply
B) an increase in supply
C) an increase in the quantity supplied
D) a decrease in the quantity supplied
Correct Answer:

Verified
Correct Answer:
Verified
Related Questions
Q56: The quantity supplied of a good or
Q87: Suppose that the incomes of buyers in
Q88: Market demand is given as Qd =
Q89: Suppose that a decrease in the price
Q90: What will happen if the price of
Q91: How is a market supply curve constructed?<br>A)
Q93: A supply curve slopes upward because, all
Q94: Smart phones are normal goods. What will
Q95: A dress manufacturer is expecting higher prices
Q96: Figure 4-2 <img src="https://d2lvgg3v3hfg70.cloudfront.net/TB7554/.jpg" alt="Figure 4-2