Multiple Choice
Figure 13-2
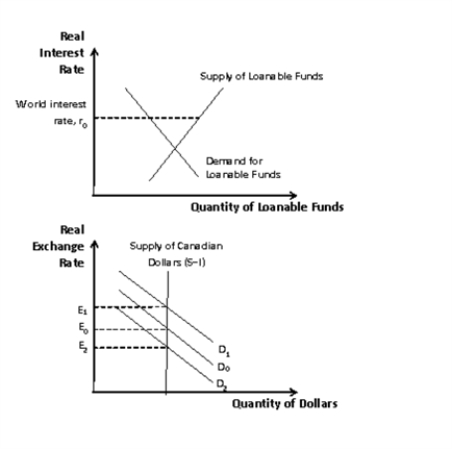
-Refer to the FigurE13-2. Which of the following shifts shows the effects of an import quota?
A) a shift of the supply of Canadian dollars (S-I) curve to the right
B) a shift from D₀ to D₁
C) a shift from D₀ to D₂
D) a shift of the demand for loanable funds curve to the right
Correct Answer:

Verified
Correct Answer:
Verified
Q9: What is most likely to increase exports
Q38: In the open-economy macroeconomic model, where does
Q41: In an open economy, what does net
Q43: Figure 13-2<br> <img src="https://d2lvgg3v3hfg70.cloudfront.net/TB1269/.jpg" alt="Figure 13-2
Q49: In the open-economy macroeconomic model, what does
Q62: When a country imposes a trade restriction,
Q156: What is the most likely result from
Q158: In an open economy, what best identifies
Q179: In the market for foreign-currency exchange in
Q191: What is the correct way to show