Multiple Choice
Figure 16-4 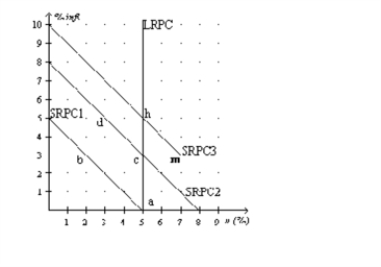
-Refer to the Figure 16-4.At point m,how do actual and expected inflation rates and unemployment rates compare?
A) The actual inflation rate exceeds the expected inflation rate and the actual unemployment rate exceeds the natural rate of unemployment.
B) The actual inflation rate exceeds the expected inflation rate and the actual unemployment rate is less than the natural rate of unemployment.
C) The actual inflation rate is less than the expected inflation rate and the actual unemployment rate exceeds the natural rate of unemployment.
D) The actual inflation rate is less than the expected inflation rate and the actual unemployment rate is less than the natural rate of unemployment.
Correct Answer:

Verified
Correct Answer:
Verified
Q6: What will an adverse supply shock cause
Q8: Use the AD/AS model and the Phillips
Q42: This exercise uses an aggregate-supply curve and
Q110: In responding to the Phillips curve hypothesis,
Q140: How does the short-run Phillips curve reflect
Q152: Figure 16-3 <img src="https://d2lvgg3v3hfg70.cloudfront.net/TB4801/.jpg" alt="Figure 16-3
Q153: Figure 16-2 <img src="https://d2lvgg3v3hfg70.cloudfront.net/TB4801/.jpg" alt="Figure 16-2
Q157: Figure 16-1 <img src="https://d2lvgg3v3hfg70.cloudfront.net/TB4801/.jpg" alt="Figure 16-1
Q158: What would shift the long-run Phillips curve
Q159: Figure 16-4 <img src="https://d2lvgg3v3hfg70.cloudfront.net/TB4801/.jpg" alt="Figure 16-4