Multiple Choice
Figure 17.9
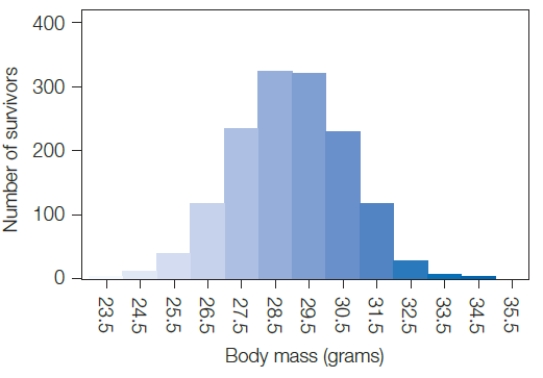
-The graph above shows the survival of sociable weavers as a function of body mass.Sociable weaver body mass seems to be an example of ____.
A) directional selection
B) stabilizing selection
C) sexual selection
D) disruptive selection
E) artificial selection
Correct Answer:

Verified
Correct Answer:
Verified
Q63: The Hardy-Weinberg law is useful for <br>A)
Q64: Two or more alleles of a gene
Q65: For the following statements, select the best
Q66: All of the following are reproductive isolating
Q67: Microevolution is change in the _ of
Q69: _ selection leads to forms of traits
Q70: What term best describes a driver of
Q71: Choose the most appropriate letter for each.<br>-p2<br>A)a
Q72: Gene flow counters the effects of mutation,_,and
Q73: _occurs when a trait has been repurposed