Multiple Choice
The graph below shows the 16-hour mortality resulting from exposing talapia to different concentrations of the dinoflagellate Pfiesteria. 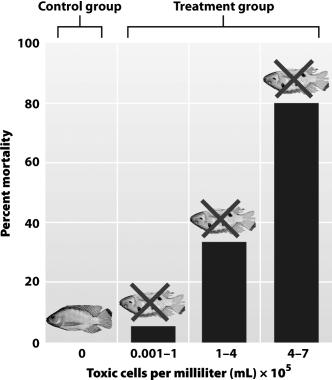
Had high mortality occurred in the control group it would indicate that
A) a more robust fish species should be used; the experiment had a fundamental design flaw.
B) the talapia had an undiagnosed preexisting illness at the beginning of the experiment.
C) Pfiesteria was not the toxic agent responsible for the death of the fish.
D) talapia is not suitable for captive experiments.
Correct Answer:

Verified
Correct Answer:
Verified
Q44: Polar bears are white, which makes them
Q45: Living organisms are intimately connected to the
Q46: Through the process of _, a group
Q47: The observation that polar ice floes are
Q47: Which statement best summarizes the information presented
Q50: Plants and animals need a variety of
Q51: Plants convert the energy in _ into
Q52: Living cells are separated from the outside
Q53: A group of interbreeding organisms whose offspring
Q54: There is a unity in the characteristics