Multiple Choice
The figure below is a diagram of the inner mitochondrial membrane. 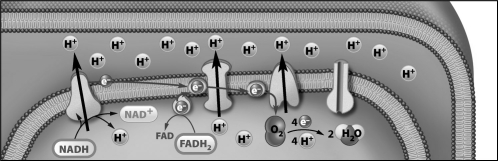
How did the protons (H⁺) in this diagram become concentrated on one side of the membrane?
A) The H⁺ were pumped across the membrane by the electron transport chain.
B) The H⁺ were released when ATP phosphorylated a membrane protein.
C) ATP was used to pump the H⁺ across the membrane.
D) Oxygen must release two H⁺ in the intermembrane space before it can move into the matrix.
Correct Answer:

Verified
Correct Answer:
Verified
Q13: Each time you take a breath you
Q13: Only animal cells carry out oxidative phosphorylation.
Q15: _ organisms require oxygen in order to
Q16: The diagram below shows the Calvin cycle,
Q19: Since plants are able to capture energy
Q20: The illustration below indicates that photosynthesis and
Q21: What is the role of water in
Q22: The burning pain in your muscles during
Q38: Energy is used to force protons from
Q74: Oxidative phosphorylation includes an electron transport chain.