Multiple Choice
According to the figure below, the r allele is less frequent in generation II of this flower population. The frequency of r decreases in this population because 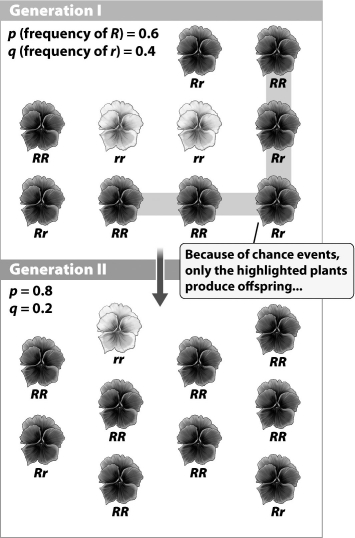
A) of genetic drift.
B) recessive alleles are always less common than dominant alleles.
C) p + q must always equal 1.
D) R alleles are more likely to "hide" r alleles in generation II.
Correct Answer:

Verified
Correct Answer:
Verified
Q14: In natural selection, _ that increase survival
Q15: The shape of the graph below indicates
Q16: The four mechanisms that cause microevolution include
Q17: In fish undergoing sexual selection, females are
Q18: The human allele that causes six fingers
Q20: A population of 8,250 mice occupies the
Q21: Genetic drift has a greater effect on<br>A)moths
Q22: Although millions of prairie chickens once occupied
Q23: Allele frequency refers to the rate of
Q24: In the Hardy-Weinberg equation, _ represents the