Multiple Choice
The bell-shaped curve at the top of the figure below shows the distribution of a phenotype in a population at the start of an experiment. The three graphs (lettered A-C) beneath predict what the distribution will look like if a certain type of selection occurs. Which graph represents what the phenotypic distribution will look like if the population undergoes stabilizing selection? 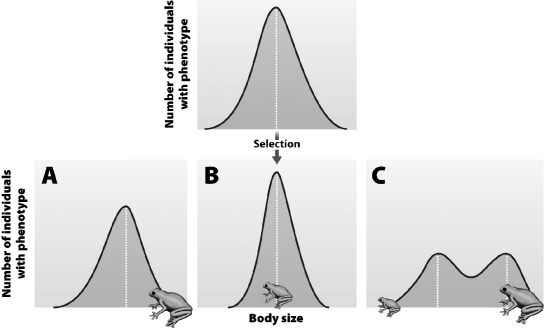
A) Graph A
B) Graph B
C) Graph C
D) These graphs all show natural selection, but none show stabilizing selection.
Correct Answer:

Verified
Correct Answer:
Verified
Q61: A used car is shipped from Australia
Q62: Disruptive selection operates whenever<br>A)natural selection is disrupted
Q63: Is the effect of an individual permanently
Q64: In the figure below, the flying bird
Q65: Which of the following statements concerning evolution
Q67: Microevolution<br>A)does not alter the genotype frequencies of
Q68: Larger male elephant seals have more mates
Q69: If the genotype values predicted by the
Q70: What is the total number of alleles
Q71: If a given population has 30 RR