Multiple Choice
Why have the two plant populations depicted in the diagram below become so different in the time they were separated by the ocean? 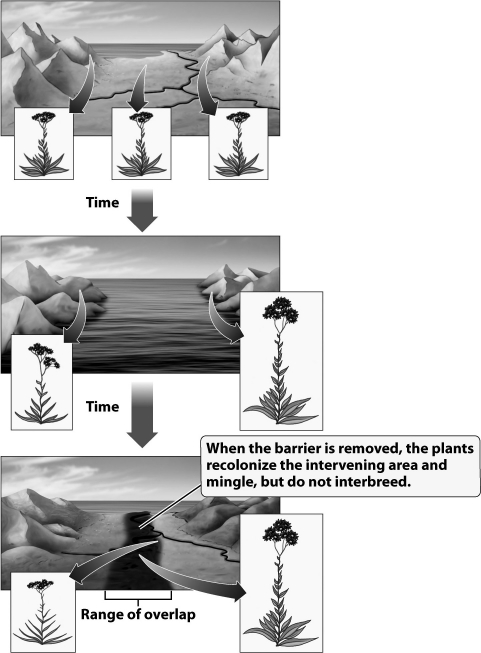
A) Founder's effect; a small group of individuals carrying only the tall allele established a new population on the right side of the ocean.
B) The amount of gene flow between the two populations increased when the ocean separated the plants, so mutations moved from one population to another.
C) When sea levels rose, it killed all of the plants on the right side of the figure. A new species evolved from another plant species already existing in the mountains on the right.
D) The separated populations adapted to the different environments on each side of the ocean and became reproductively isolated.
Correct Answer:

Verified
Correct Answer:
Verified
Q28: Geographic isolation limits the _ between populations
Q32: The only modern humans that exhibit Neandertal
Q33: An organism is polyploid if it has
Q35: A flower is red, has a long
Q38: Adaptive evolution allows species to<br>A)reduce mutation rate.<br>B)decrease
Q41: Some species of orchids attract wasps to
Q42: The observation that the flowers of this
Q54: Gene flow prevents two populations from becoming
Q68: Individuals of the same species generally<br>A) experience
Q76: Which of the following is an example