Short Answer
The figure below shows the net primary productivity (NPP)in marine biomes around the world.
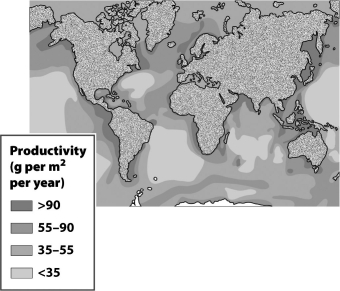
One factor that influences the areas with >90 g/m² per year in the above diagram involving nutrient-rich layers being driven to the surface is ____________________.
Correct Answer:

Verified
Correct Answer:
Verified
Q1: With respect to the following values,rain with
Q11: Net primary productivity in a terrarium could
Q49: Other than the polar tundra, the least
Q50: The Arctic tundra will begin to release
Q50: On average,what percentage of the energy from
Q52: Pollutants from industrial areas may contain _,which
Q55: The figure below illustrates how nutrients cycle
Q57: In the Hubbard Brook Experimental Forest in
Q58: As the northern latitudes warm, frozen peat
Q62: Phosphorus is the only major nutrient whose