Multiple Choice
The graph below shows the rate of cell division in a developing frog embryo. 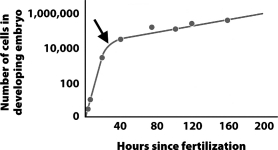
Why does the rate of growth decrease dramatically after the point indicated by the arrow?
A) At this point, development switches from rapid cell growth to cell differentiation and migration.
B) The arrow indicates when the embryo begins to run out of its internal food source and must find another source to continue developing.
C) This is when fertilization occurs. Before this point, the single-celled egg was growing quickly as it stored food. After this point, growth slows for the more deliberate process of development.
D) At the time indicated by the arrow, the trophoblast separates from the inner cell mass and the two tissues begin to divide at different and slower rates.
Correct Answer:

Verified
Correct Answer:
Verified
Q1: Which of the following behaviors is not
Q2: In human females, primary oocytes do not
Q3: The teen birthrate can be reduced by
Q4: The shape of the beak of a
Q4: The three layers of cells in a
Q5: The mitochondria in your cells are a
Q7: Organisms that have both functional testes and
Q9: Women who wish to have children after
Q10: Genes are generally switched on or off
Q67: Land animals are more likely to undergo