Multiple Choice
The graph below shows the normal concentration of morphogens A and B throughout a Drosophila embryo. 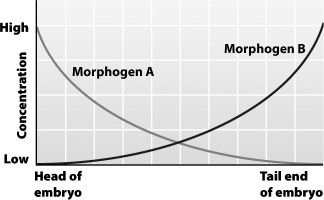
If morphogen B is injected into the head end of an embryo, the embryo is likely to develop
A) normally.
B) a second tail at the head end.
C) a second head at the tail end.
D) two heads at the head end.
Correct Answer:

Verified
Correct Answer:
Verified
Q1: In the last few weeks of pregnancy,the
Q16: Animal species in which the offspring tend
Q18: Which of the following statements about hermaphrodites
Q19: Different versions of the protein hemoglobin are
Q22: By the end of a normal first
Q23: The highest teen birthrates are in areas
Q24: The skulls of newborn humans and chimpanzees
Q26: In humans, the yolk sac<br>A)does not contain
Q28: Human females probably evolved the ability to
Q29: During labor more and more oxytocin is