Not Answered
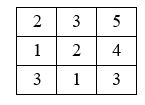
The diagram below represents a cost raster, with the origin at the upper left corner. (1) What is the cost for moving from (col. 1, row. 1) to (col. 2, row 1)? (2) What is the cost for moving from (col. 1, row. 1) to (col. 2, row 2)? (3) What is the least accumulative cost from (col. 1, row. 1) to (col. 2, row 3)?
Correct Answer:

Verified
Correct Answer:
Verified
Q19: Shortest-path analysis is used to solve the
Q20: Explain the difference between a network and
Q21: Which of the following is true about
Q22: A _ link connects a cell to
Q23: Cost distance measure operations are based on
Q24: Explain the difference between the minimum impedance
Q25: What is the main objective of the
Q26: One-way streets are treated as _in network
Q27: Which of the following is a common
Q29: In ArcGIS a network dataset can be