Not Answered
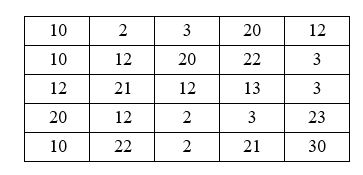
The following diagram shows a raster with its origin (0, 0) at the upper left corner. Suppose that the raster is used for a couple of 3-by-3 neighborhood operations. (1) What is the range statistic for (col. 3, row3)? (2) What is the majority statistic for (col. 3, row3)? (3) What is the variety statistic for (col. 3, row3)?
Correct Answer:

Verified
Correct Answer:
Verified
Q2: Illustrate with a diagram a 3-by-3 neighborhood
Q3: Which of the following can be used
Q4: How does a local operation differ from
Q5: A zonal operation can be run with
Q6: You have downloaded from the Internet an
Q8: Define "map algebra" for raster data analysis.
Q9: Suppose you are asked to produce a
Q10: Which of the following mathematical functions can
Q11: An analysis mask limits analysis to cells
Q12: A local operation is limited to only