Not Answered
The following figure shows an overlay (Intersect) operation. "A" represents the input (polygon) layer with ID values from 1 to 4; "B" represents the intersect (polygon) layer with the ID values of 10 and 11; and "C" is a graphic representation of the overlay operation.
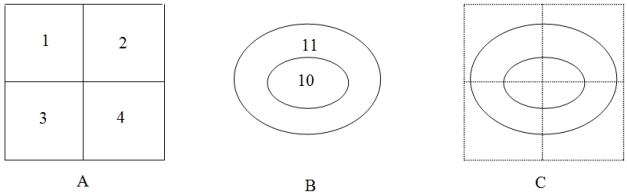 1) How many polygons will the output have?
2) How many records in the output will have the ID value of 3 from the input layer?
3) How many records in the output will have the ID value of 11 from the intersect layer?
Correct Answer:

Verified
Correct Answer:
Verified
Q5: You have downloaded a shapefile from a
Q6: Provide an application example in which a
Q7: Buffering a point creates a buffer zone
Q8: Which overlay method combines the area extents
Q9: Which of the following conditions is required
Q11: Which of the following analyses is also
Q12: Describe an example in which areal interpolation
Q13: ArcGIS does not automatically update the area
Q14: Provide an application example in which a
Q15: Suppose an input layer shows a county