Multiple Choice
The following figure illustrates the market demand curve for wine.
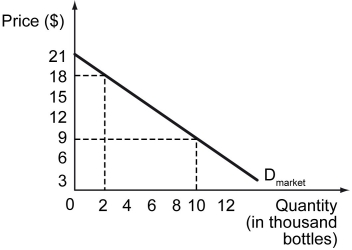
-Refer to the figure above.What is the loss in the market-wide consumer surplus when the price of wine changes from $9 per bottle to $18 per bottle?
A) $144,000
B) $30,000
C) $57,000
D) $0
Correct Answer:

Verified
Correct Answer:
Verified
Q75: Which of the following is NOT a
Q76: The following figure displays John's budget constraint
Q77: The following figure shows the indifference curves
Q78: The set of all possible bundles of
Q79: Sandra consumes two goods: tea and coffee.Her
Q81: Which of the following correctly describes incentives?<br>A)
Q82: The following figure shows some indifference curves
Q83: Scenario: Maylin is shopping at the sporting
Q84: The following table shows the total benefit
Q85: The following table shows the marginal benefit