Multiple Choice
The following figure shows the market demand curve for calculators.
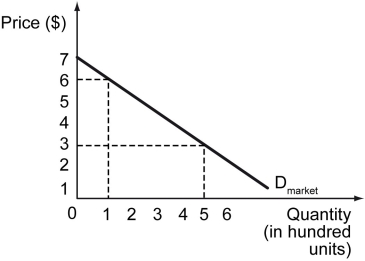
-Refer to the figure above.What is the market-wide consumer surplus when the market price of calculators is $6 per unit?
A) $20
B) $35
C) $50
D) $70
Correct Answer:

Verified
Correct Answer:
Verified
Related Questions
Q50: If the price of the good measured
Q51: Willingness to pay _.<br>A) is the lowest
Q52: Which of the following statements best describes
Q53: A(n)_ shows the bundles of two goods
Q54: Now suppose the demand curve remains constant
Q56: The cross-price elasticity of demand for a
Q57: An optimizing consumer makes her purchase decisions
Q58: Which of the following statements correctly identifies
Q59: The following figure shows a consumer's budget
Q60: The following table shows the total benefit