Multiple Choice
The following figure shows the market demand curve for calculators.
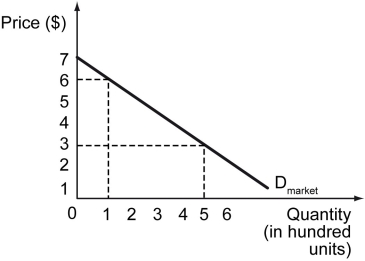
-Refer to the figure above.What is the gain in the market-wide consumer surplus when the price of calculators changes from $6 per unit to $3 per unit?
A) $565
B) $580
C) $950
D) $1,050
Correct Answer:

Verified
Correct Answer:
Verified
Q145: A consumer's budget refers to the _.<br>A)
Q146: The following table shows the benefit that
Q147: For an individual,consumer surplus measures _.<br>A) willingness
Q148: The following figure displays John's budget constraint
Q149: Which of the following statements is true
Q151: _ is a measure of the satisfaction
Q152: The following figure shows the market demand
Q153: The Law of Demand explains why _.<br>A)
Q154: As the _ increases,_.<br>A) quantity demanded of
Q155: In a perfectly competitive market,all consumers _.<br>A)