Multiple Choice
The following figure illustrates the market demand curve for solar-powered lights.
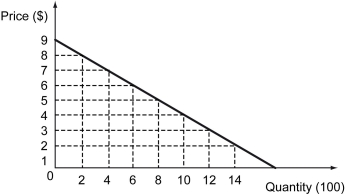
-Refer to the figure above.What is the absolute value of the arc elasticity of demand for solar-powered lights when their price falls from $8 to $4?
A) 2
B) 4
C) 8
D) 10
Correct Answer:

Verified
Correct Answer:
Verified
Related Questions
Q1: Economists estimate that the income elasticity of
Q3: The following table shows the total benefit
Q4: Scenario: When the price of wine is
Q5: Dawn has preferences for minor league baseball
Q6: If a good has a price elasticity
Q7: Which of the following pairs of goods
Q8: From the information provided in the following
Q9: Jack has an income of $150 per
Q10: Which of the following formulas is used
Q11: The demand for a good is relatively