Multiple Choice
The following figure illustrates the market demand curve for solar-powered lights.
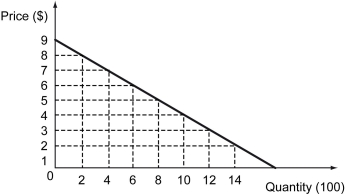
-Refer to the figure above.What is the absolute value of the arc elasticity of demand for solar-powered lights when their price decreases from $5 to $2?
A) 0.64
B) 1.25
C) 1.75
D) 2.00
Correct Answer:

Verified
Correct Answer:
Verified
Q174: Sofia is selling homemade cakes.The demand for
Q175: What are the determinants of the price
Q176: Luxury goods have an income elasticity _.<br>A)
Q177: In the graph above,which bundles of jeans
Q178: Suppose the government imposes a tax on
Q180: The following figure shows the budget constraint
Q181: The manager of the Kendall Square Bertucci's
Q182: The following figure illustrates the market demand
Q183: While making a purchase decision,a buyer should
Q184: Your budget constraint contains _.<br>A) only those