Multiple Choice
The following figure illustrates the market demand curve for solar-powered lights.
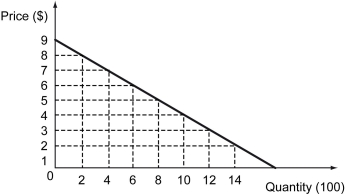
-Refer to the figure above.What is the absolute value of the arc elasticity of demand for solar-powered lights when their price increases from $6 to $8?
A) 1.25
B) 2.75
C) 3.50
D) 4.00
Correct Answer:

Verified
Correct Answer:
Verified
Related Questions
Q22: Consumer surplus is _.<br>A) the difference between
Q23: a)Define the term "consumer surplus." If your
Q24: Assume that a consumer can spend $20
Q25: If the quantity of milk is measured
Q26: Which of the following statements is true
Q28: Greenaqua Corp.is the only supplier of bottled
Q29: The substitution effect of a price change
Q30: The following figure shows the indifference curves
Q31: What are the factors that determine a
Q32: John is ready to pay $5 for