Multiple Choice
The figure below shows the cost curves of a firm in a competitive market. The firm always makes the choice to maximize its profit.
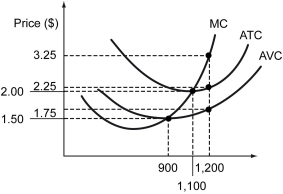
-Refer to the figure above.If the market price of the product is $1.50,the firm's profit maximizing output is ________ and its maximum profit is ________.
A) 1,200 units; -$900
B) 1,100 units; -$300
C) 900 units; $0.00
D) 0 or 900 units; -$600
Correct Answer:

Verified
Correct Answer:
Verified
Q42: The long-run supply curve for a firm
Q43: The figure below shows cost curves of
Q44: Consider the following two scenarios:<br>i)The marginal product
Q45: The figure below shows the marginal cost
Q46: A bakery that produces 100 loaves of
Q48: Which market is more likely to be
Q49: The output of a bakery is 250
Q50: The figure below shows the marginal cost
Q51: The following table shows the total output,
Q52: If price is greater than average total