Multiple Choice
The following figure depicts a firm's long-run average total cost and selected short-run average total cost curves.
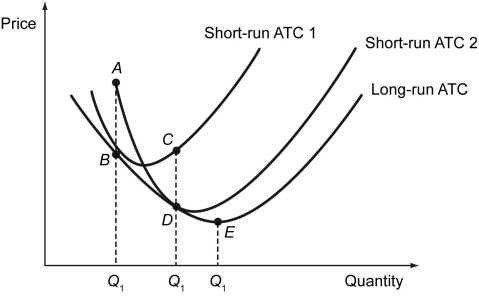
-Refer to the figure above.The firm is currently producing at point B.An increase in its capital may be represented by ________.
A) a movement to A
B) a movement to C
C) a movement to D
D) a movement to E
Correct Answer:

Verified
Correct Answer:
Verified
Q70: The total cost of a firm is
Q71: The firm maximizes profits by _.<br>A) shutting
Q72: Specialization is the result of _.<br>A) hiring
Q73: Which of the following is an example
Q74: The following figure shows the cost curves
Q76: The following table shows the total output,
Q77: Differentiate between the terms "revenue" and "profit."
Q78: The equilibrium price of a good sold
Q79: Scenario: David runs a janitorial service company.
Q80: Scenario: The figure below shows the supply