Multiple Choice
The following figure shows the cost curves on a firm that operates in a competitive market. Assume that all the firms in this market have identical cost structure.
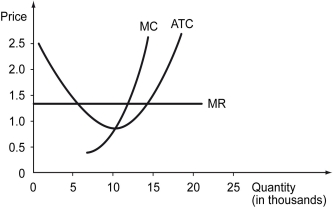
-Refer to the graph above.Which of the following graphs correctly represents this competitive market's demand and supply in the short run?
A) 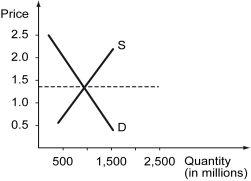
B) 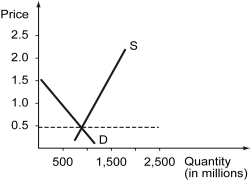
C) 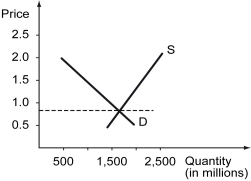
D) 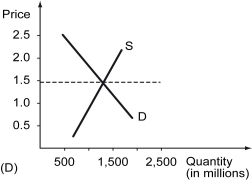
Correct Answer:

Verified
Correct Answer:
Verified
Related Questions
Q48: Which market is more likely to be
Q49: The output of a bakery is 250
Q50: The figure below shows the marginal cost
Q51: The following table shows the total output,
Q52: If price is greater than average total
Q54: A firm sells 30 units of its
Q55: Which of the following is true of
Q56: Which of the following is NOT an
Q57: Which of the following is true for
Q58: The following figure depicts the supply curve