Multiple Choice
Scenario: The figure below shows the supply and the demand for a good (left) and the cost curves of an individual firm in this market (right) . Initially, all firms in this market have identical cost curves MC₁ and ATC₁, and the market is in equilibrium at point A. Subsequently, a new production technology has been developed for this product. Some of the existing firms as well as some new firms have adopted the new technology, and their cost curves are MC₂ and ATC₂.
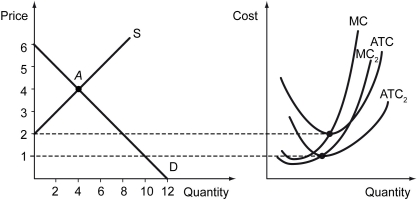
-Refer to the figure above.At the initial equilibrium A,________.
A) only the firms with new technology enter the market
B) only the firms with old technology enter the market
C) both firms with old and new technologies enter the market
D) existing firms (with old technology) exit the market
Correct Answer:

Verified
Correct Answer:
Verified
Q63: When the price of a good increases
Q64: Free entry is said to exist in
Q65: Which of the following is the difference
Q66: Which of the following statements is true?<br>A)
Q67: The exit of a firm _.<br>A) is
Q69: A good with a perfectly inelastic supply
Q70: The total cost of a firm is
Q71: The firm maximizes profits by _.<br>A) shutting
Q72: Specialization is the result of _.<br>A) hiring
Q73: Which of the following is an example