Multiple Choice
The following figure shows the marginal cost curve and the average total cost curve of a firm operating in a perfectly competitive industry.
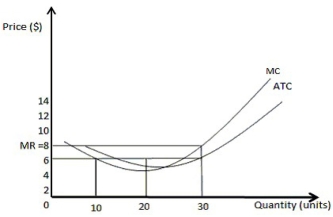
-Refer to the figure above.What is the maximum profit that the firm can make?
A) $30
B) $60
C) $90
D) $180
Correct Answer:

Verified
Correct Answer:
Verified
Related Questions
Q60: The total surplus in a market is
Q61: The following figure shows the demand and
Q62: The following table displays the reservation values
Q63: The following table displays the reservation values
Q64: Producer surplus is the _.<br>A) sum of
Q66: What is likely to happen to the
Q67: The following table displays the reservation values
Q68: A firm owns two production plants. The
Q69: The existence of positive profits in a
Q70: Efficiency in competitive markets is characterized by