Multiple Choice
The following figure represents the cost curves of two firms operating in different perfectly competitive industries. This economy consists only of industries 1 and 2.
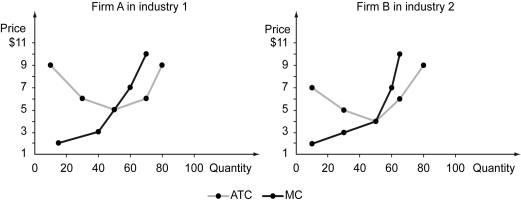
-Refer to the figure above.If the market price in industry 1 is $3 and the market price in industry 2 is $4,we should expect ________ in the long run.
A) firm A to exit industry 1 and enter industry 2
B) firm B to exit industry 2 and enter industry 1
C) firm A to exit industry 1 and not enter industry 2
D) both firms to stay in their respective industries
Correct Answer:

Verified
Correct Answer:
Verified
Q20: The following figure illustrates the demand and
Q21: The following figure illustrates the demand and
Q22: The following table displays the reservation values
Q23: If a seller's reservation value for a
Q24: If restrictions on entry and exit of
Q26: The tables below show reservation values of
Q27: After the imposition of the price controls,
Q28: The social surplus in a market is
Q29: The reservation value of a buyer reflects
Q30: Which of the following statements is true?<br>A)