Multiple Choice
The following figure shows the production possibilities curve for a software engineer who has to divide her available time between producing computer programs and Web sites.
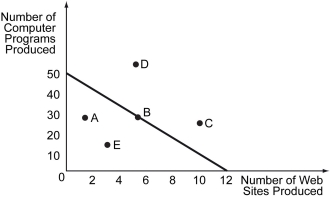
-Refer to the figure above.If the engineer spends her entire time producing computer programs,how many computer programs can she produce?
A) 12
B) 30
C) 45
D) 50
Correct Answer:

Verified
Correct Answer:
Verified
Q194: Scenario: Now suppose the United States continues
Q195: Scenario: Yasmin and Zeek are lawyers working
Q196: Protectionism leads to _.<br>A) subsidization of imports<br>B)
Q197: Points on a production possibilities curve are
Q198: Scenario: Hawaii and South Carolina are trading
Q200: The following figure shows the demand curve,
Q201: Which of the following statements is true?<br>A)
Q202: Increasing opportunity cost can arise if _.<br>A)
Q203: The following figure depicts the production possibilities
Q204: The figure below shows the domestic supply