Multiple Choice
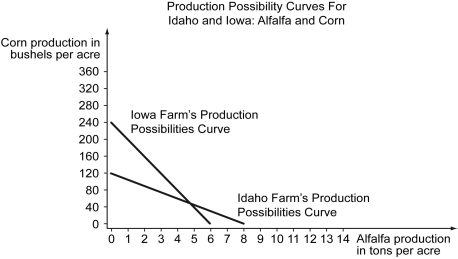
Scenario: The following production possibilities schedules and curves represent the amount of corn and alfalfa that can be produced on an acre of land in Idaho and Iowa.
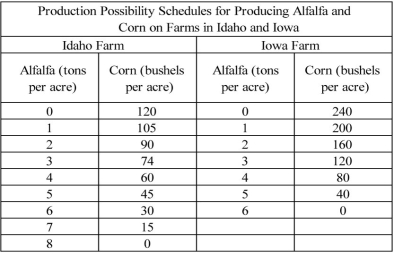
These production possibilities schedules are shown in the following figure.
-Refer to the scenario above.The opportunity cost of a ton of alfalfa in Idaho is ________.
A)  of a bushel of corn
B) 1 bushel of corn
C) 15 bushels of corn
D) 120 bushels of corn
Correct Answer:

Verified
Correct Answer:
Verified
Q169: Scenario: The following figure shows the demand
Q170: Which of the following organizations keeps track
Q171: The following figure shows the demand curve,D,and
Q172: Scenario: Now suppose the United States can
Q173: Scenario: Viola and Davis are two students
Q175: The following figure shows the demand curve,
Q176: The table below shows the domestic price
Q177: The slope of a production possibility curve
Q178: The following figure shows the demand curve,
Q179: Which of the following statements is true?<br>A)