Multiple Choice
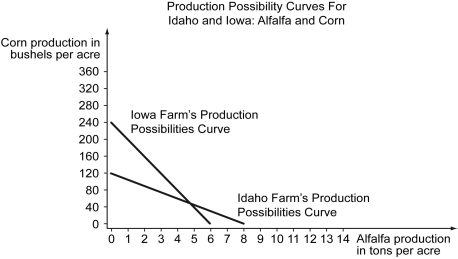
Scenario: The following production possibilities schedules and curves represent the amount of corn and alfalfa that can be produced on an acre of land in Idaho and Iowa.
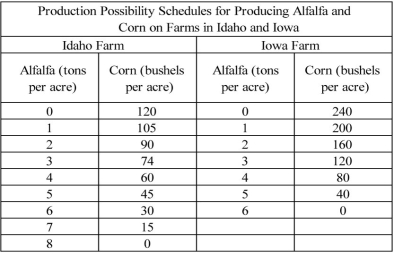
These production possibilities schedules are shown in the following figure.
-Refer to the scenario above.The opportunity cost of a bushel of corn in Iowa is ________.
A)  of a ton of alfalfa
B) 1 ton of alfalfa
C) 6 tons of alfalfa
D) 40 tons of alfalfa
Correct Answer:

Verified
Correct Answer:
Verified
Q66: The following figure shows the demand curve,
Q67: The slope of a production possibilities curve
Q68: Which of the following correctly identifies an
Q69: What are the infant industry arguments against
Q70: The following figure shows the production possibilities
Q72: The U.S.wheat market is represented by the
Q73: The following figure shows the demand curve,
Q74: Scenario: The following figure shows the demand
Q75: Suppose a nation opens up to free
Q76: Scenario: Yasmin and Zeek are lawyers working