Multiple Choice
The following figure depicts a nonlinear production possibilities curve.
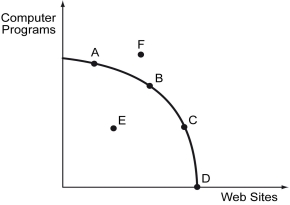
-Refer to the figure above.Point E represents a situation that ________.
A) is currently unattainable and can be expected to remain so
B) will be attainable only if there is economic growth
C) results from inefficient use of resources or failure to use all available resources
D) has a higher opportunity cost than do points on the boundary itself
Correct Answer:

Verified
Correct Answer:
Verified
Q100: Scenario: With her available resources, Wendy can
Q101: Specialization occurs when each individual,firm,or country _.<br>A)
Q102: Scenario: The following figure shows the demand
Q103: The following figure shows the demand curve,
Q104: If a nation opens up to free
Q106: Trade between two nations _.<br>A) results in
Q107: Scenario: The domestic supply and demand of
Q108: The following figure shows the demand curve,
Q109: What are the effects of a tariff
Q110: Scenario: With her available resources, Wendy can