Essay
The following figure illustrates the production possibilities curve of a farmer who has to decide on the quantities of wheat and rice to produce for a given amount of resources.Three possible production combinations-A,B,and C-are marked on the figure.
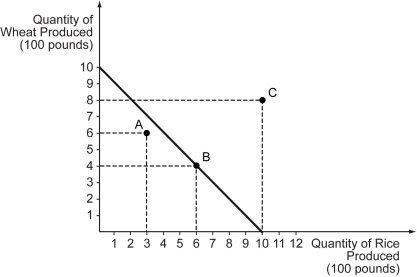
a)Which of the three combinations of wheat and rice,marked on the graph,is both efficient and attainable? Explain your answer.
b)Calculate the opportunity cost of producing both wheat and rice.
Correct Answer:

Verified
a)Point A in the graph represents a comb...View Answer
Unlock this answer now
Get Access to more Verified Answers free of charge
Correct Answer:
Verified
View Answer
Unlock this answer now
Get Access to more Verified Answers free of charge
Q180: The following figure shows the demand curve,
Q181: Scenario: The following figure shows the demand
Q182: The domestic supply and demand of a
Q183: Points inside a production possibilities curve are
Q184: Which of the following correctly identifies an
Q186: Which of the following can be a
Q187: In Lithasia,the opportunity cost of producing a
Q188: Iowa produces a small amount of wool
Q189: Even though points inside a production possibilities
Q190: Which of the following causes an outward