Multiple Choice
The following figure shows the production possibilities curves (PPCs) of two individuals, Ryan and Tom.
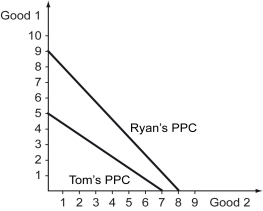
-Refer to the figure above.Which of the following statements is true?
A) Ryan has a comparative advantage in the production of Good 1, whereas Tom has a comparative advantage in the production of Good 2.
B) Ryan has a comparative advantage in the production of Good 2, whereas Tom has a comparative advantage in the production of Good 1.
C) Ryan has a comparative advantage in the production of both goods.
D) Tom has a comparative advantage in the production of both goods.
Correct Answer:

Verified
Correct Answer:
Verified
Q73: The following figure shows the demand curve,
Q74: Scenario: The following figure shows the demand
Q75: Suppose a nation opens up to free
Q76: Scenario: Yasmin and Zeek are lawyers working
Q77: The following figure depicts a nonlinear production
Q79: A curve that shows the various combinations
Q80: Points inside a production possibilities curve are
Q81: The following figure illustrates the production possibilities
Q82: The following figure depicts four different scenarios
Q83: The curvature of an economy's production possibilities