Multiple Choice
The following figure shows the production possibilities curves (PPCs) of two individuals, Ryan and Tom.
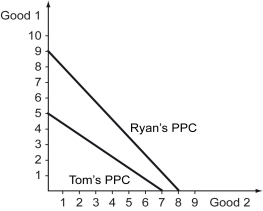
-Refer to the figure above.Which of the following statements is true?
A) Ryan's opportunity cost of producing Good 1 is higher than that of Tom, whereas Tom's opportunity cost of producing Good 2 is higher than that of Ryan.
B) Ryan's opportunity cost of producing Good 2 is higher than Tom's opportunity cost of producing it.
C) Ryan has a comparative disadvantage in the production of both goods.
D) Tom has a comparative disadvantage in the production of both goods.
Correct Answer:

Verified
Correct Answer:
Verified
Q131: Scenario: Suppose the world price is $2
Q132: Scenario: Norway and Sweden each produce cloudberries
Q133: The following figure shows the demand curve,
Q134: The following figure depicts a nonlinear production
Q135: A firm producing calculators and cell phones
Q137: Which of the following best describes a
Q138: The shift toward more open,integrated economies that
Q139: Scenario: Hawaii and South Carolina are trading
Q140: Scenario: Now suppose the United States continues
Q141: The following figure shows the demand curve,