Multiple Choice
The following figure depicts the production possibilities curve when Ann and Bob engage in trade. With all her resources, Ann can either produce two computer programs or one Web site. With all his resources, Bob can either produce one computer program or three Web sites.
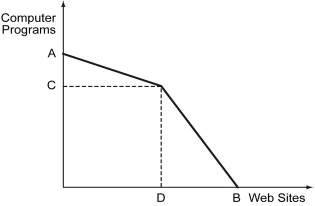
-Refer to the figure above.The flatter portion of this curve has a slope equal to ________.
A) Ann's PPC
B) Bob's PPC
C) Ann's minus Bob's PPC
D) Ann's plus Bob's PPC
Correct Answer:

Verified
Correct Answer:
Verified
Q114: Scenario: Meryl and Steve are two classmates
Q115: A production possibilities curve is plotted for
Q116: Free trade refers to the ability of
Q117: Scenario: Yasmin and Zeek are lawyers working
Q118: The following table shows the value of
Q120: Scenario: Jack takes 3 hours to complete
Q121: The figure below shows the potential gains
Q122: The underlying motivation for trade,relies on one
Q123: Which of the following is not a
Q124: The use of government regulations and barriers