Multiple Choice
The figure below shows production possibilities curves for tomatoes and oranges in two prefectures in a country.
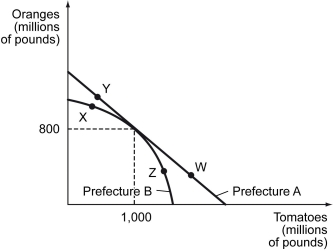
-Refer to the figure above.In Prefecture A,the opportunity cost of producing each additional pound of tomatoes ________.
A) increases as more tomatoes are produced
B) stays the same as more tomatoes are produced
C) decreases as more tomatoes are produced
D) increases up to 1 billion (1,000 million) pounds and then decreases after 1 billion pounds
Correct Answer:

Verified
Correct Answer:
Verified
Q24: The following figure shows the demand curve,
Q25: Scenario: Viola and Davis are two students
Q26: An export is any good that is
Q27: The following figure shows the demand curve,
Q28: The figure below shows the domestic supply
Q30: If a nation is a net importer,it
Q31: The following figure shows the demand curve,
Q32: If a nation opens up to free
Q33: The figures below show markets for solar
Q34: Scenario: Jack takes 3 hours to complete