Multiple Choice
The figure below shows production possibilities curves for tomatoes and oranges in two prefectures in a country.
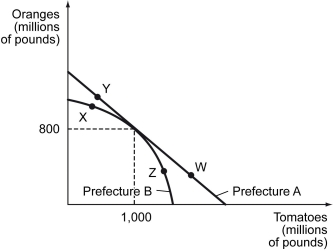
-Refer to the figure above. Suppose that Prefecture A produces at point Y, while Prefecture B produces at point Z. Could there be gains from trade (Prefecture A sells oranges to Prefecture B, and Prefecture B sells tomatoes to Prefecture B) ? Why or why not?
A) Yes, because Prefecture A has a comparative advantage in orange production up to 800 million pounds while Prefecture B has a comparative advantage in tomato production beyond 1 billion pounds.
B) Yes, because Prefecture A produces more oranges while Prefecture B produces more tomatoes.
C) No, because Prefecture A's opportunity cost of producing additional pound of tomatoes at W is higher than Prefecture B's opportunity cost at X.
D) No, because Prefecture A's opportunity cost of producing additional pound of oranges at W is higher than Prefecture B's opportunity cost at X.
Correct Answer:

Verified
Correct Answer:
Verified
Q153: _ countries,in an effort to promote economic
Q154: The following figure depicts four different scenarios
Q155: Scenario: The following figure shows the demand
Q156: Scenario: Meryl and Steve are two classmates
Q157: Scenario: Jack takes 3 hours to complete
Q159: Scenario: Yasmin and Zeek are lawyers working
Q160: Scenario: The domestic supply and demand of
Q161: The following figure shows the demand curve,
Q162: Scenario: A machine that can be used
Q163: The ability of an individual,firm,or country to