Multiple Choice
The following figure depicts four different scenarios in which the blue line represents California's production possibilities curve (PPC) and the red line represents Texas' PPC. These two states trade wine and cloth.
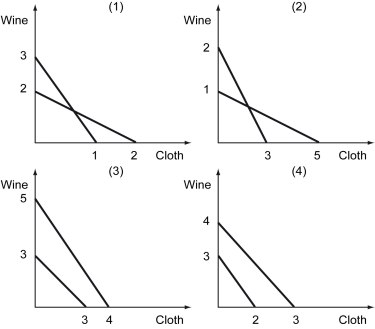
-Refer to the figure above.In what scenario would the terms of trade of cloth for wine be between 1 and 1.25?
A) (1)
B) (2)
C) (3)
D) (4)
Correct Answer:

Verified
Correct Answer:
Verified
Q8: Which of the following statements is true
Q9: Which of the following statements best describes
Q10: Which of the following arguments is not
Q11: The following figure represents various production possibilities
Q12: The table below shows the domestic price
Q14: The following figure shows the demand curve,
Q15: Which of the following correctly identifies an
Q16: Scenario: Norway and Sweden each produce cloudberries
Q17: The following figure shows the demand curve,
Q18: The following table shows the value of