Multiple Choice
The following figure shows the demand curve, D, and the supply curve, S, for calculators in Barylia in four different scenarios. Barylia is open to free trade.
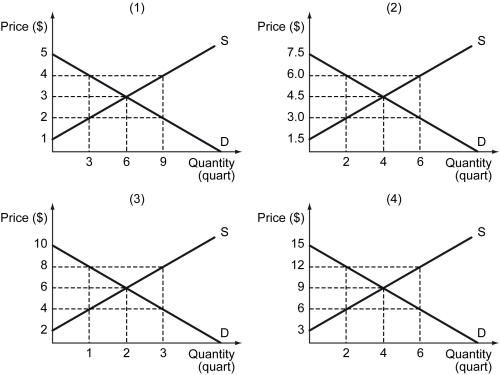
-Refer to the figure above.Let the world price of calculators be $4.In what scenario(s) does Barylia become a net exporter of calculators?
A) (1)
B) (2)
C) (1) and (3)
D) (2) , (3) , and (4)
Correct Answer:

Verified
Correct Answer:
Verified
Q125: A few decades ago,there were hardly any
Q126: Which of the following is likely to
Q127: The following figure depicts the production possibilities
Q128: Which of the following statements is true?<br>A)
Q129: Scenario: Now suppose the United States can
Q131: Scenario: Suppose the world price is $2
Q132: Scenario: Norway and Sweden each produce cloudberries
Q133: The following figure shows the demand curve,
Q134: The following figure depicts a nonlinear production
Q135: A firm producing calculators and cell phones