Multiple Choice
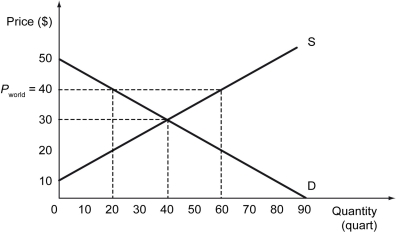
The following figure shows the demand curve, D, and the supply curve, S, for calculators in Barylia. The world price of calculators is $40.

-Refer to the figure above.What is the producer surplus after Barylia opens up to free trade?
A) $225
B) $550
C) $750
D) $900
Correct Answer:

Verified
Correct Answer:
Verified
Q223: Scenario: The following figure shows the demand
Q224: The following figure shows the production possibilities
Q225: The following figure shows the demand curve,
Q226: The following figure shows the demand curve,
Q227: The following figure shows the demand curve,
Q229: The following figure shows the demand curve,
Q230: The production possibilities schedules and curves for
Q231: Two countries,A and B,produce Good X.Which of
Q232: Scenario: You learned in the textbook that
Q233: Which of the following statements is true?<br>A)