Multiple Choice
The following figure shows the market supply and demand of a good whose consumption entails a $2 positive external benefit per unit.
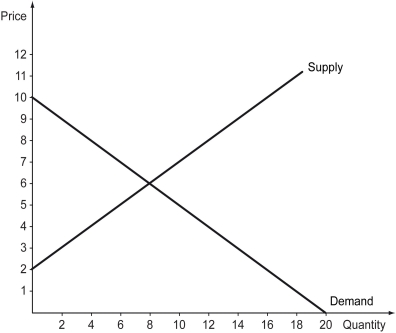
-Refer to the figure above.The socially optimal quantity of this good should be ________ units.
A) 6
B) 7
C) 8
D) 10
Correct Answer:

Verified
Correct Answer:
Verified
Q87: Which of the following is an example
Q88: In practice,assessing the benefits and costs of
Q89: Scenario: Frank and Nancy live in a
Q90: Scenario: The following excerpt is from Timothy
Q91: Explanation: The following figure graphs the answer.<br>
Q93: _ are non-excludable in consumption.<br>A) Public goods
Q94: Which of the following is true if
Q95: Scenario: The following excerpt is from Timothy
Q96: An economic agent _ when he accounts
Q97: A Pigouvian subsidy leads to a socially