Multiple Choice
The figure below shows the demand, supply, and marginal social benefit curves for Good Y.
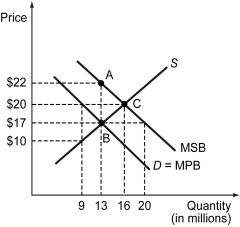
-Refer to the figure above.How many units of Good Y will be supplied when the market is free?
A) 9 million
B) 16 million
C) 13 million
D) 20 million
Correct Answer:

Verified
Correct Answer:
Verified
Related Questions
Q64: Overfishing leading to a rapid depletion of
Q65: Private solutions to externalities are most effective
Q66: A Pigouvian tax is also called a(n)_.<br>A)
Q67: A room heater is a _.<br>A) club
Q68: A government regulation that bans the use
Q70: People seldom break a line while waiting
Q71: What causes the overexploitation and depletion of
Q72: If the government taxed away all profits
Q73: Which of the following is the best
Q74: Government invention is required to solve externality