Multiple Choice
The figure below shows the demand, supply, and marginal social benefit curves for Good Y.
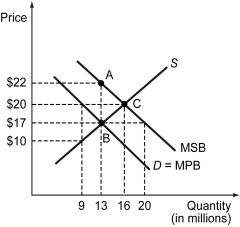
-Refer to the figure above.Social welfare will be maximized if ________ units of Good Y are produced.
A) 9 million
B) 20 million
C) 13 million
D) 16 million
Correct Answer:

Verified
Correct Answer:
Verified
Q202: Scenario: Vacant houses, foreclosed or abandoned, are
Q203: Tom is willing to contribute $400 toward
Q204: A Pigouvian tax is a tax designed
Q205: Scenario: A chemical factory is located upstream
Q206: Scenario: Currently, major corn-growing states, such as
Q208: _ is an example of a common
Q209: Most municipalities and states in the northeastern
Q210: The congestion charge is an example of
Q211: Scenario: Ron plays loud music, which prevents
Q212: When does a private solution to a