Multiple Choice
The following figure shows the production function for a perfectly competitive firm.
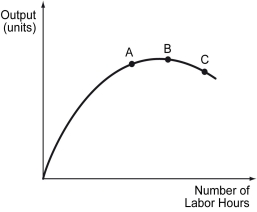
-Refer to the figure above.Which of the following statements is true?
A) The slope of the production function between Points B and C indicates positive returns to labor.
B) The slope of the production function between Points A and B indicates increasing returns to labor.
C) The slope of the production function between Points A and B indicates decreasing returns to labor.
D) The slope of the production function between Points A and C indicates increasing returns to labor.
Correct Answer:

Verified
Correct Answer:
Verified
Q1: Marnie works at the guest check-in desk
Q2: The following figure depicts the labor markets
Q3: A college graduate getting paid more than
Q4: Other things remaining the same,which of the
Q6: In Major League Baseball,a player's WAR (wins
Q7: The following table shows the output of
Q8: A firm should consume physical capital until
Q9: Which of the following statements correctly identifies
Q10: Scenario: Consider a firm that produces and
Q11: The following figure depicts a specific firm's