Multiple Choice
The following figure shows price versus demand in a given market.
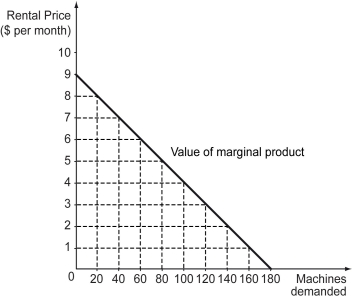
-Refer to the figure above.What is the optimal number of machines rented if the market rental price is $8 per month?
A) 20 machines
B) 40 machines
C) 160 machines
D) 180 machines
Correct Answer:

Verified
Correct Answer:
Verified
Related Questions
Q98: How does the price of a final
Q99: Which of the following is likely to
Q100: The market implications of taste-based discrimination were
Q101: Scenario: This problem applies the principle of
Q102: Which of the following correctly identifies the
Q104: Scenario: There are two regional labor markets
Q105: Which of the following statements is true?<br>A)
Q106: Paul wants to renovate his home and
Q107: How are skilled and unskilled workers in
Q108: If leisure is a normal good,how will